Dashboard Overview
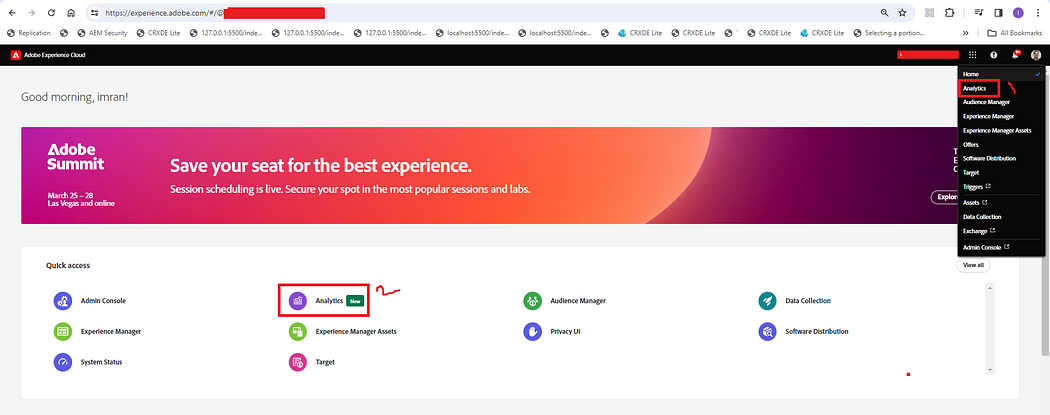
To access Adobe Analytics tool click on this link and select below highlighted option open once page is open.
We have below two way to redirect to Adobe Analytics as shown below. Select one of the options to visit Adobe Analytics Page.
Below is the view we are going to have once analytics page is open. Let’s discuss things one by one present on the page.
Left side on the page we are having below things:
Projects: number of Adobe Analytics projects created.
Reports: To check report for particular project.
Learning: Adobe provides some basics learning material to get high level overview of Adobe Analytics.

Build Project: This is an option to create a new Adobe Analytics project.
Check Out What’s New will take us to the release notes page.
Create Project
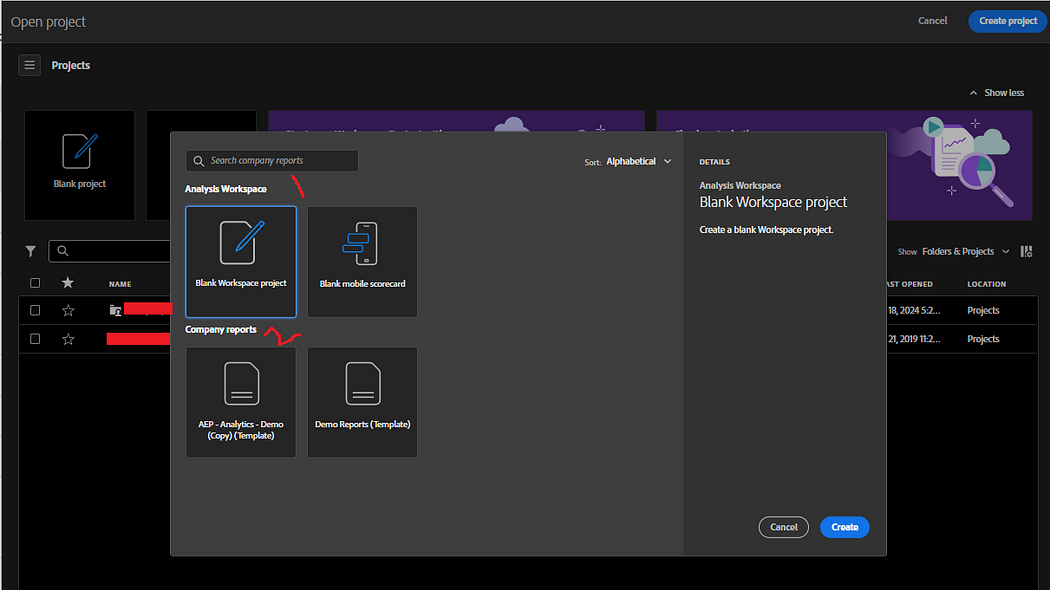
Click on Create Project option on top right page will show a popup to choose templates. Analysis Workspace is for provided OOTB and below to that we have company specific reports setup by admin which we can create under Reports section.
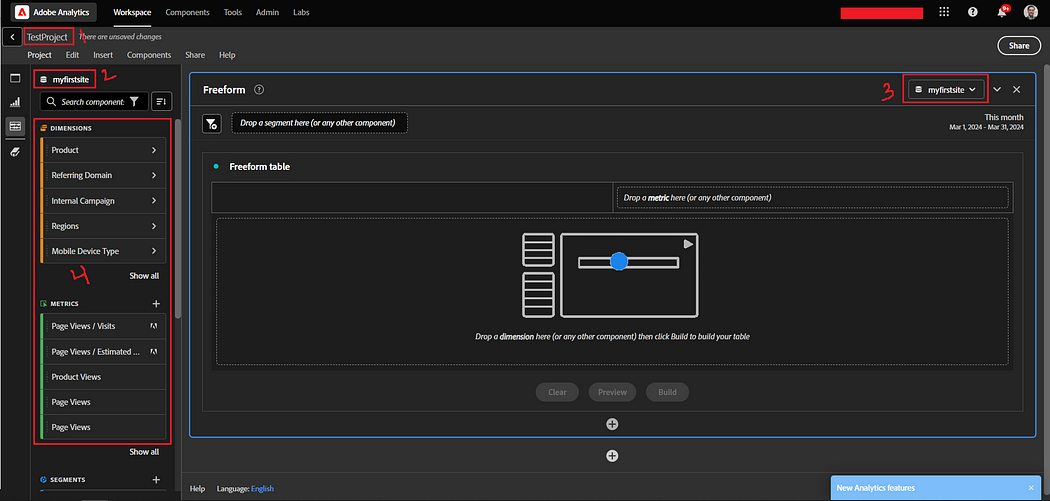
We can provide project name highlighted as as option 1. Option highlighted as 2 talks about selected report suit. Option 3 allow us to select report suit. Option 4 allow us to generate report using available options.
Report Suit: It is a location to collect data. Follow link to create report suit.
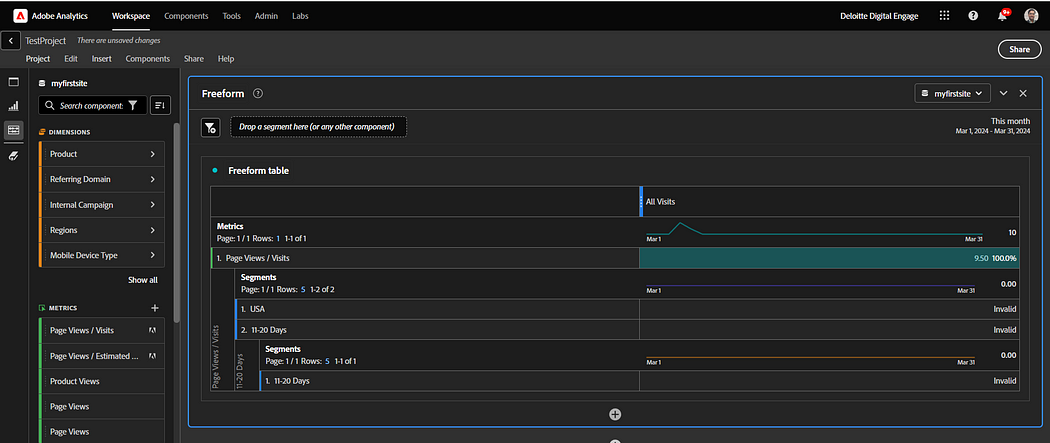
Report view after dragging and dropping some of the options:
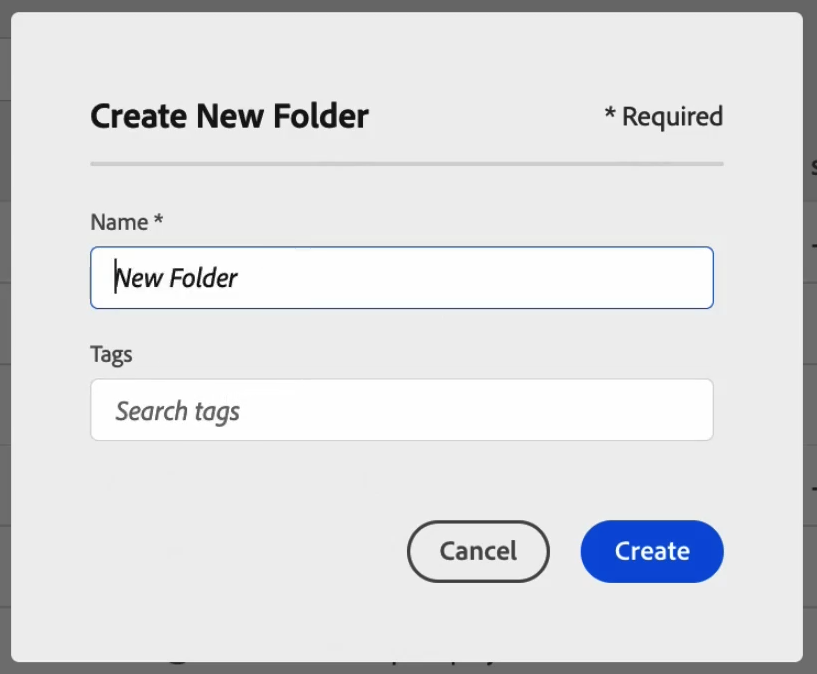
Create New Folder
On the top right we will be getting an option to create a foldr as highlighted below:

Provide folder Name and Tags (optional) to create a folder:
Company Folder
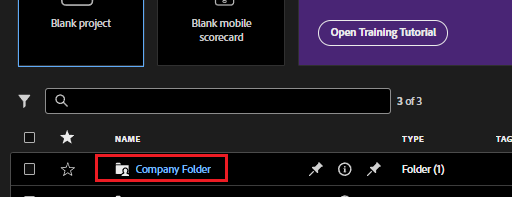
Below is the highlighted company folder which we can not delete and comes by default once we have Adobe Analytics setup for an organization. This is the folder where admin creates a project to share with marketing and different teams:
Report Section
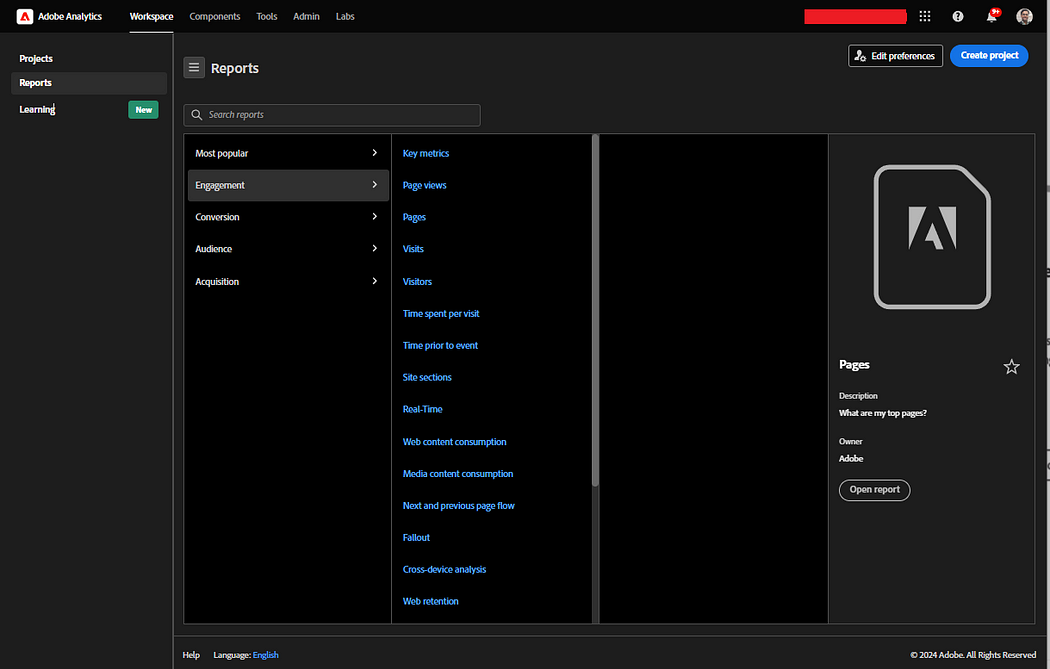
report section is combination of workspace previous and most popular page versions. It will allow us to see all of the reports available as part of Adobe Analytics.
Favorites
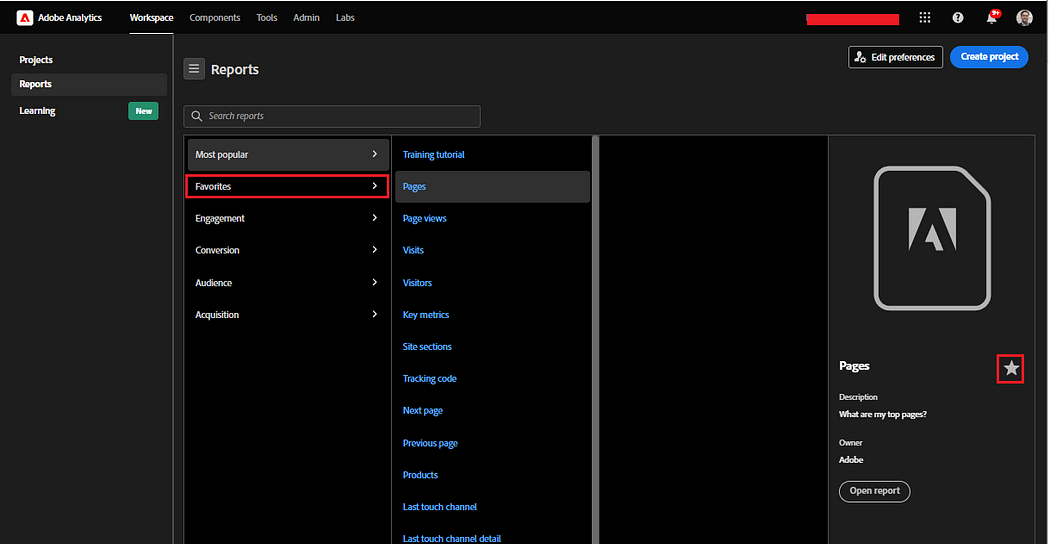
Favorites option will get add as soon as we select favorite icon for any of the report section as shown below:
We can search and find out any of the report very easily:
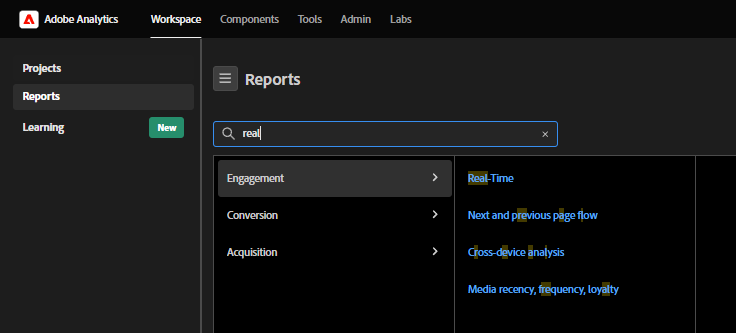
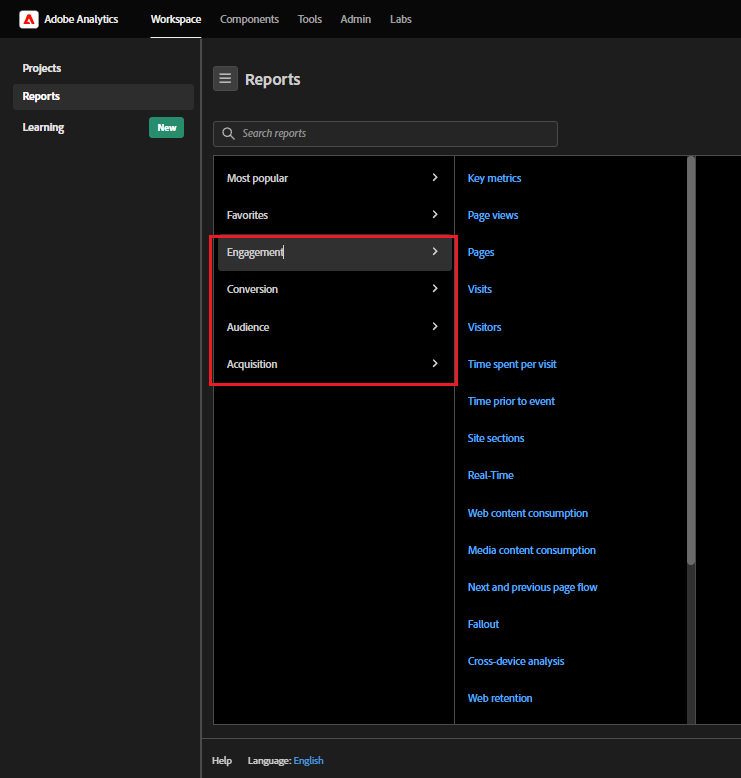
In Adobe Analytics, we have mainly four types of reports which is Engagement, Conversion, Audience and Acquisition.
Most Popular show the same reports marked as popular under and Favorite will show reports marked as favorite under Engagement, Conversion, Audience and Acquisition section.
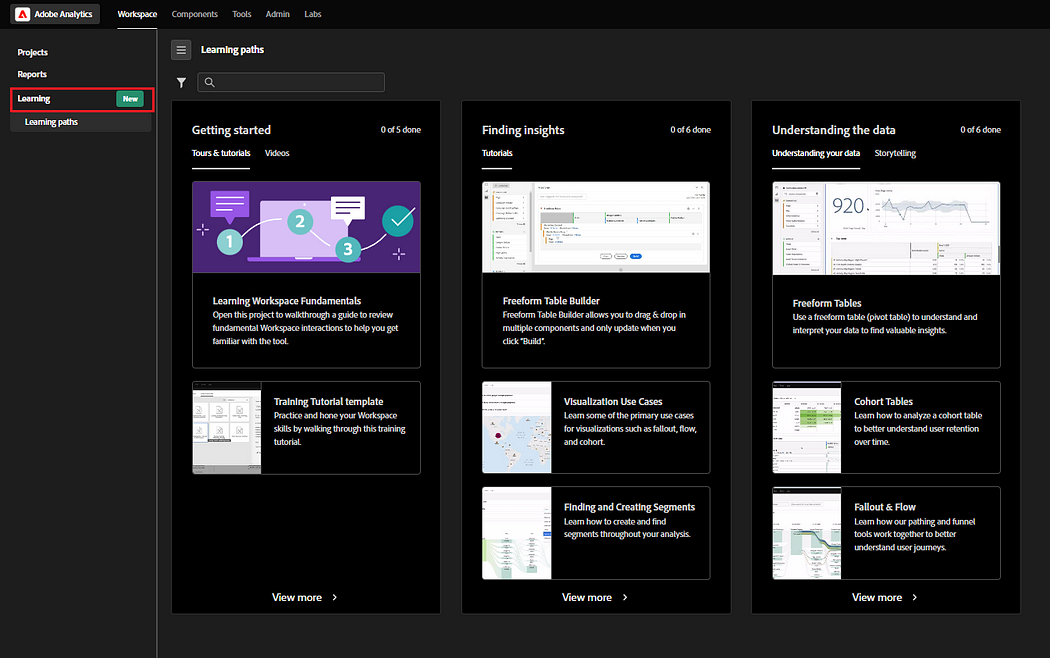
Learning Section
Below Learning section will allow us to watch videos and learn things around Adobe Analytics.
CJA (Customer Journey Analytics)
For CJA things remains same we have for Adobe Analytics. Currently we have Project and Learning section. Right now we don’t have Reports section as part of side navigation as shown below.

Components
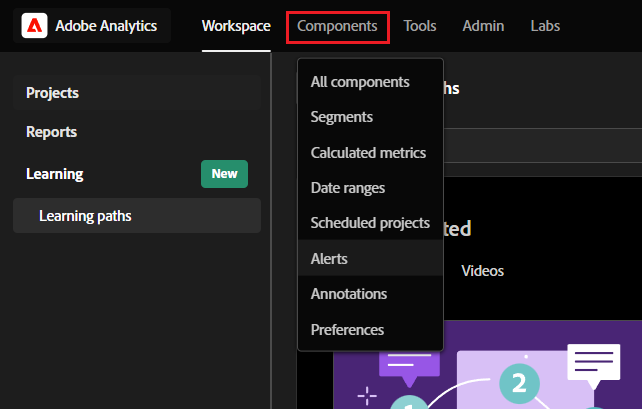
We have components option where we can check various components like segments, date ranges, alerts etc.
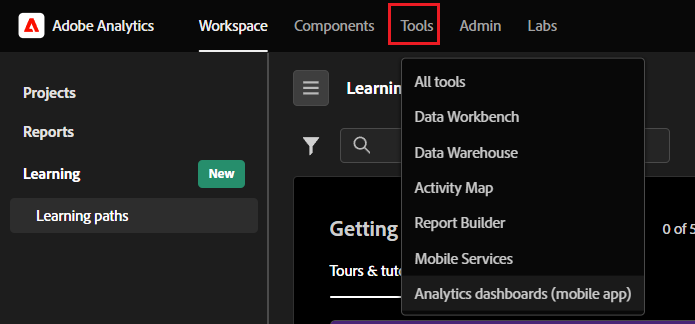
Tools
We have tools access providing various options as shown below:
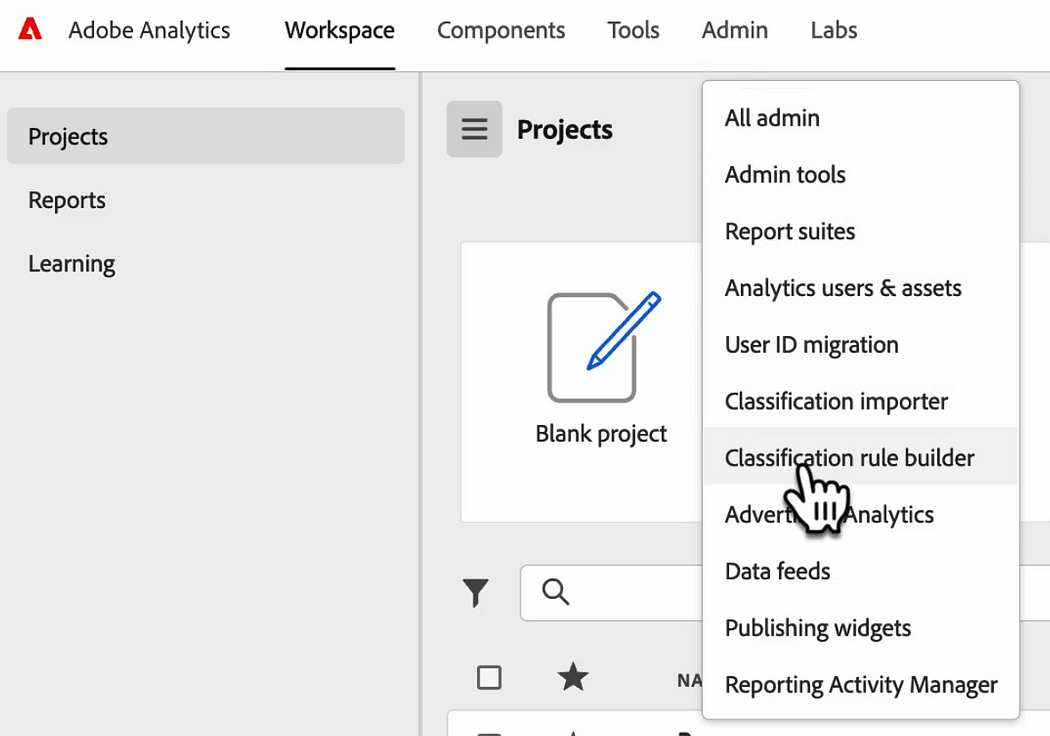
Admin
Depending on the permissions we are going to get below options to manage permissions for tools, reports, data feeds, Reporting activity manager etc.
Theme update
We can also change theme from dark to light as shown below:

Dark Theme: Below is dark theme:


Imran Khan, Adobe Community Advisor, certified AEM developer and Java Geek, is an experienced AEM developer with over 12 years of expertise in designing and implementing robust web applications. He leverages Adobe Experience Manager, Analytics, and Target to create dynamic digital experiences. Imran possesses extensive expertise in J2EE, Sightly, Struts 2.0, Spring, Hibernate, JPA, React, HTML, jQuery, and JavaScript.
